Web-Application »Waggawagga«
In the following section the single components of the user interface will shortly be presented. Simply spoken the user interface is divided in two main parts: The input mask at the top of the page and the result section of the analysis below.
Input mask
The web-based user interface provides an input form, which enables the user to upload protein sequences in plain-text or as FASTA-formatted text. On the server-side the sequence is pre-processed to filter out gaps, special characters, numbers, etc. In general characters, which does not match the FASTA-format. A specification of the FASTA-format can be found here. Additionally to garantuee the compatibility with the coiled-coil-tools, amino acid specifiers other than the 20 standard characters are removed either. This may lead to shifts in your amino acid numbering. For demonstration purposes there are three examples, which can be loaded instead of an own protein sequence.
As a next step, the coiled-coil prediction tools can be chosen out of two sets: The classic prediction tools, which deliver as a result probable coiled-coil regions, and the extended tools, which predict several types of oligomerization states on basis of the previous prediction results. Another feature, which can be customized, is the used window-length of the prediction tools. It directly influences the predicted region by smoothing the predictions with increasing windows-length, which can be 14, 21 and 28.
Result section
The result section is grouped into four subsections, which present the analysed protein sequence data in different ways. After finishing the calculation of the results, the user can find a unique job-id*(*entifier) at the top of the result section. The id is the key to very quickly restore already calculated results back. The user only has to copy and paste his job-id into the text-field on the Restore Session page. The id is valid for at least one week, and can be shared with others or used to continue an analysis at a later stage.
Domain Overview
The first subsection is the domain view, which lists an abstract sequence overview for all submitted protein sequences in combination with the selected prediction tools. Predicted coiled-coil regions are highlighted. Each sequence has an interactive slider for changing the viewable region of the current sequence. By moving the slider, the illustrations below alter instantaniously/accordingly.
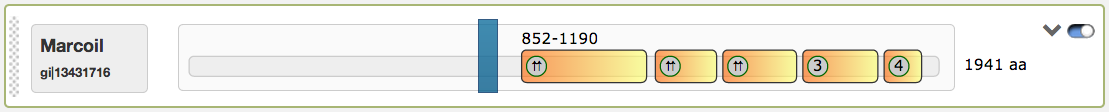
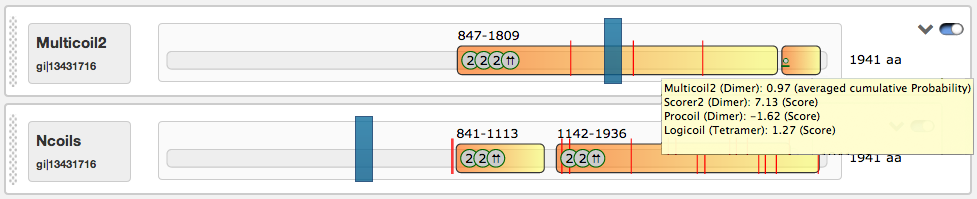
The domain view has several functions to interact with: The first figure shows the predicted coiled-coil regions for the tool Marcoil, which were calculated for the example protein sequence Myosin heavy chain IIa. Starting from left to right, the narrow rubbed zone can be used to change the order of the respective domain views through drag and drop. The grey box aside shows the used prediction-tool and the sequence title. The long box contains a grey slim bar, which represents the analysed protein sequence, with highlighted small boxes, which represent the predicted coiled-coil regions. For each coiled-coil box, the position information and the coiled-coil score can be derived in its mouse tool tip. The predicted oligomerization state is indicated in the grey bubbles. Possible values are:
| Symbol | Meaning |
|---|---|
| 2 | General dimer |
| ⇈ | Parallel dimer |
| ⇵ | Antiparallel dimer |
| 3 | Trimer |
| 4 | Tetramer |
| Combined information in case a box doesn’t provide enough space |
The predicted coiled-coil regions may contain shifts in the heptad motives, which are indicated by red lines. Shift positions can be detected by hovering with the mouse above them. The domain view contains an interactive slider that influences the rendered regions in the illustrations below (Helical wheel and Helical net views).
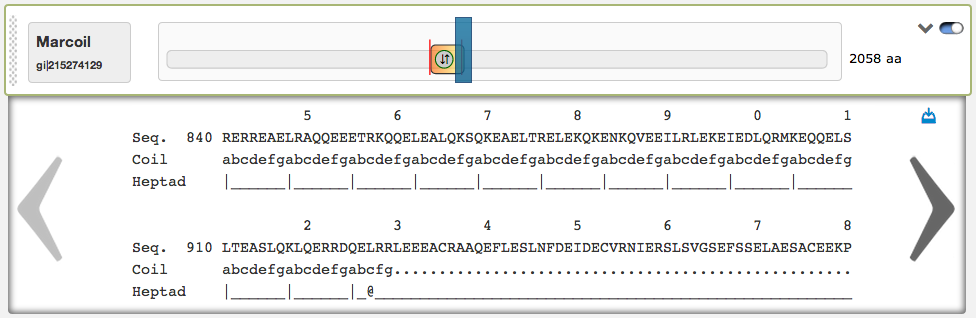
On the right side of the domain view are two buttons: The left of them opens a textual result of the prediction, that is very useful to see the predicted coiled-coil regions and heptad patterns aligned to the protein sequence. By clicking on the left/right arrows, the user can scroll through the textual result. Here is also an automatic scrolling available, the textual result automatically jumps to the corresponding sequence position, when the according slider is dragged around. In the top-right corner of the textual result box is a download link. The up/down-pointing arrow-button can be used to fade in/out the textual result.
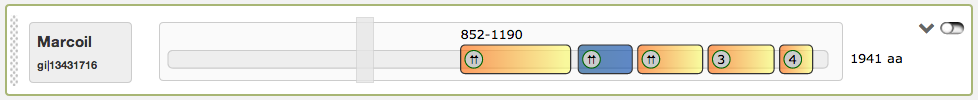
Finally the most right button in the domain view is a switch to turn the slider into an inactive state, so that the single coiled-coil regions are directly clickable. An example for this function is given in the figure below. When inactived, the slider turns into grey color and is not draggable anymore. The current active region is highlighted then in blue.
Configuration
Another part of the result section is the Configuration, which enables the user to fine-tune the selected protein sequence region for the Helical wheel view.
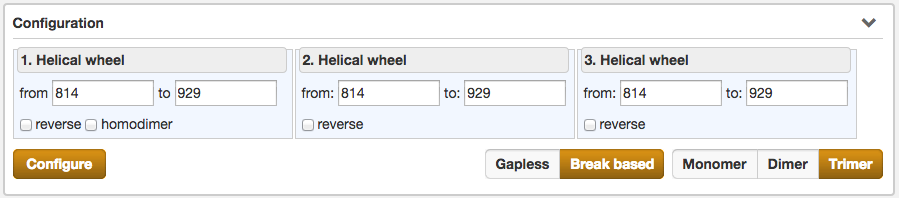
Configurations, which can be made, are the selection of the type of the helical wheel diagram. The user can choose between Monomer, Dimer or Trimer views. By switching between them, the illustration below alters instantaniously. Further functions are the precise specification of the sequence range for the wheels of the helical wheel diagram, the direction (normal/reverse) and the coiled-coil composition (heterodimer/homodimer).
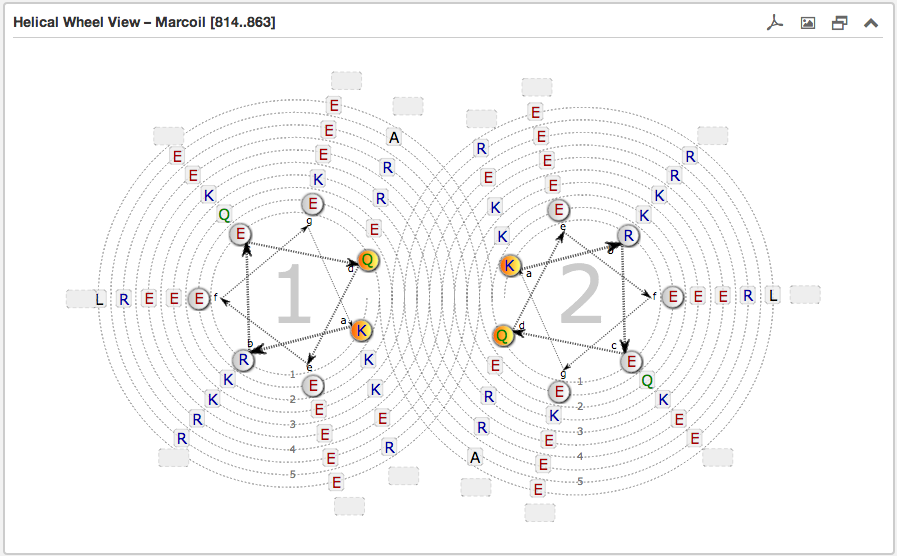
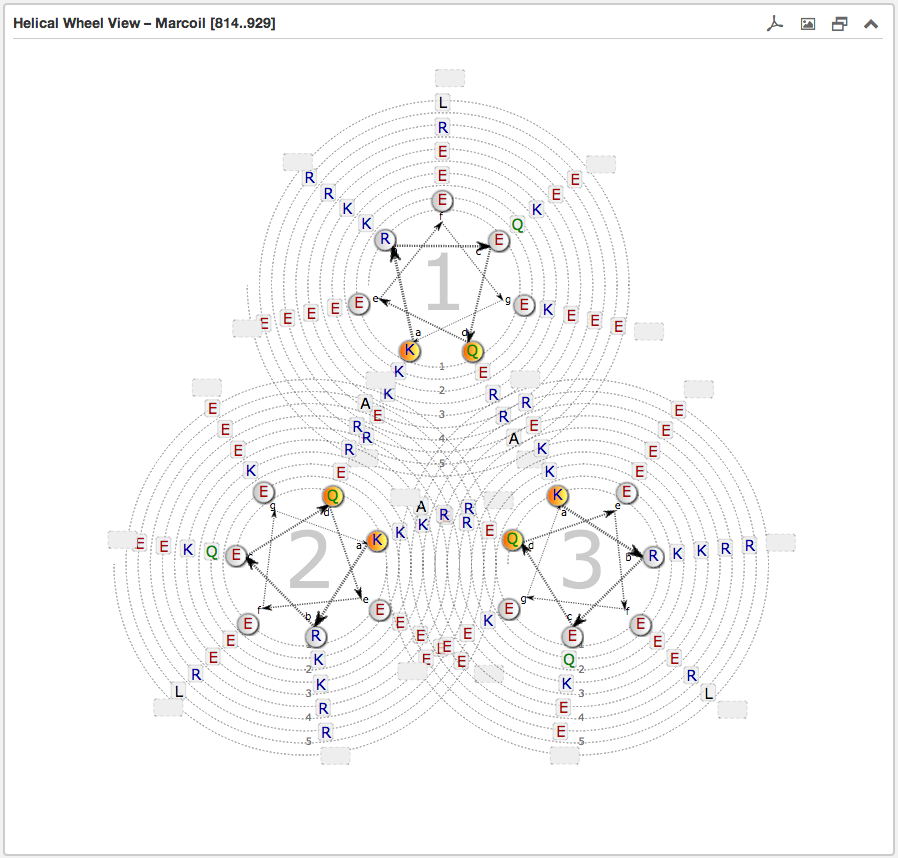
Helical wheel view
The second main subsection is the Helical wheel view. This view is designed to visualize the possible residue interactions inside a predicted coiled-coil. The view is capable to depict the three above mentioned coiled-coil types. The helical wheel view can be customized “freely” in range, direction and oligomerization state by using the above described Configuration form or simply by moving the slider along a domain view, if the user wants quickly to shift over the sequence. The pre-selected windows-length for the slider has a fixed size of 49.
Each wheel, representing a helix viewed from the top, is made up of seven groups [a,b,c,d,e,f,g] with the residues sorted according to the predicted heptad pattern. The sequence starts in the most inner circle of the wheel-spiral and follows in the arrow-indicated fashion to the outside. The heptad positions a and d are highlighted in orange and are oriented to the opposing wheel representing the inner side of a coiled-coil helix. If there are more than six residues per heptad group, the remaining residues are combined into an expandable bubble at the end of the group (outside the wheel). The group can be expanded by clicking on it. If there are less than six residues per group, the SVG-based view shrinks automatically the number of windings.
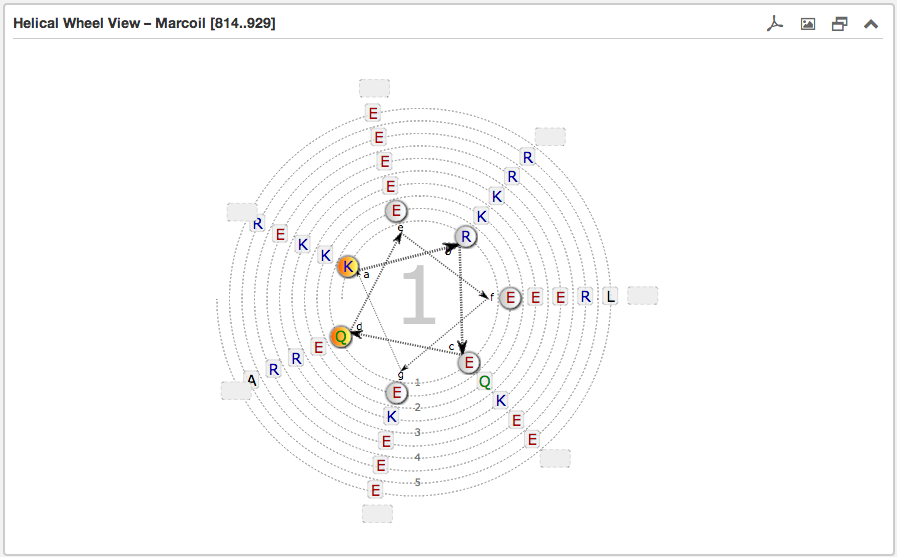
There are several common control icons, which occur repeatedly on the page. Declaring from left to right: The Adobe icon stands for a PDF download of the current view. The small picture right to it, stands for a PNG download. The small double window means that the current view can be zoomed in, in an extra overlayed viewbox (it is still interactive) and the arrow at the right stands for maximizing/minimizing the current view.

Helical Net view and the Single-Alpha-Helix Score
The web-application Waggawagga has another unique feature. In the helical net view the selected protein region is depicted in the form of an interaction net of an open-cutted single-alpha-helix. The cut, which flattens the helix, is made along the surface in the direction of the helix axis. Therefore the heptad repeat pattern is used as a basis to divide the residues in strict columns, the cut is then made along the f column. On basis of the interacting residues a score is calculated (Single-Alpha-Helix Score), which enables the user to discriminate between predicted coiled-coil regions and a Single-Alpha-Helix (SAH). A high SAH-score (values >= 0.25) for the selected protein sequence region is a strong indicator for a single-α-helix instead of a predicted coiled-coil.
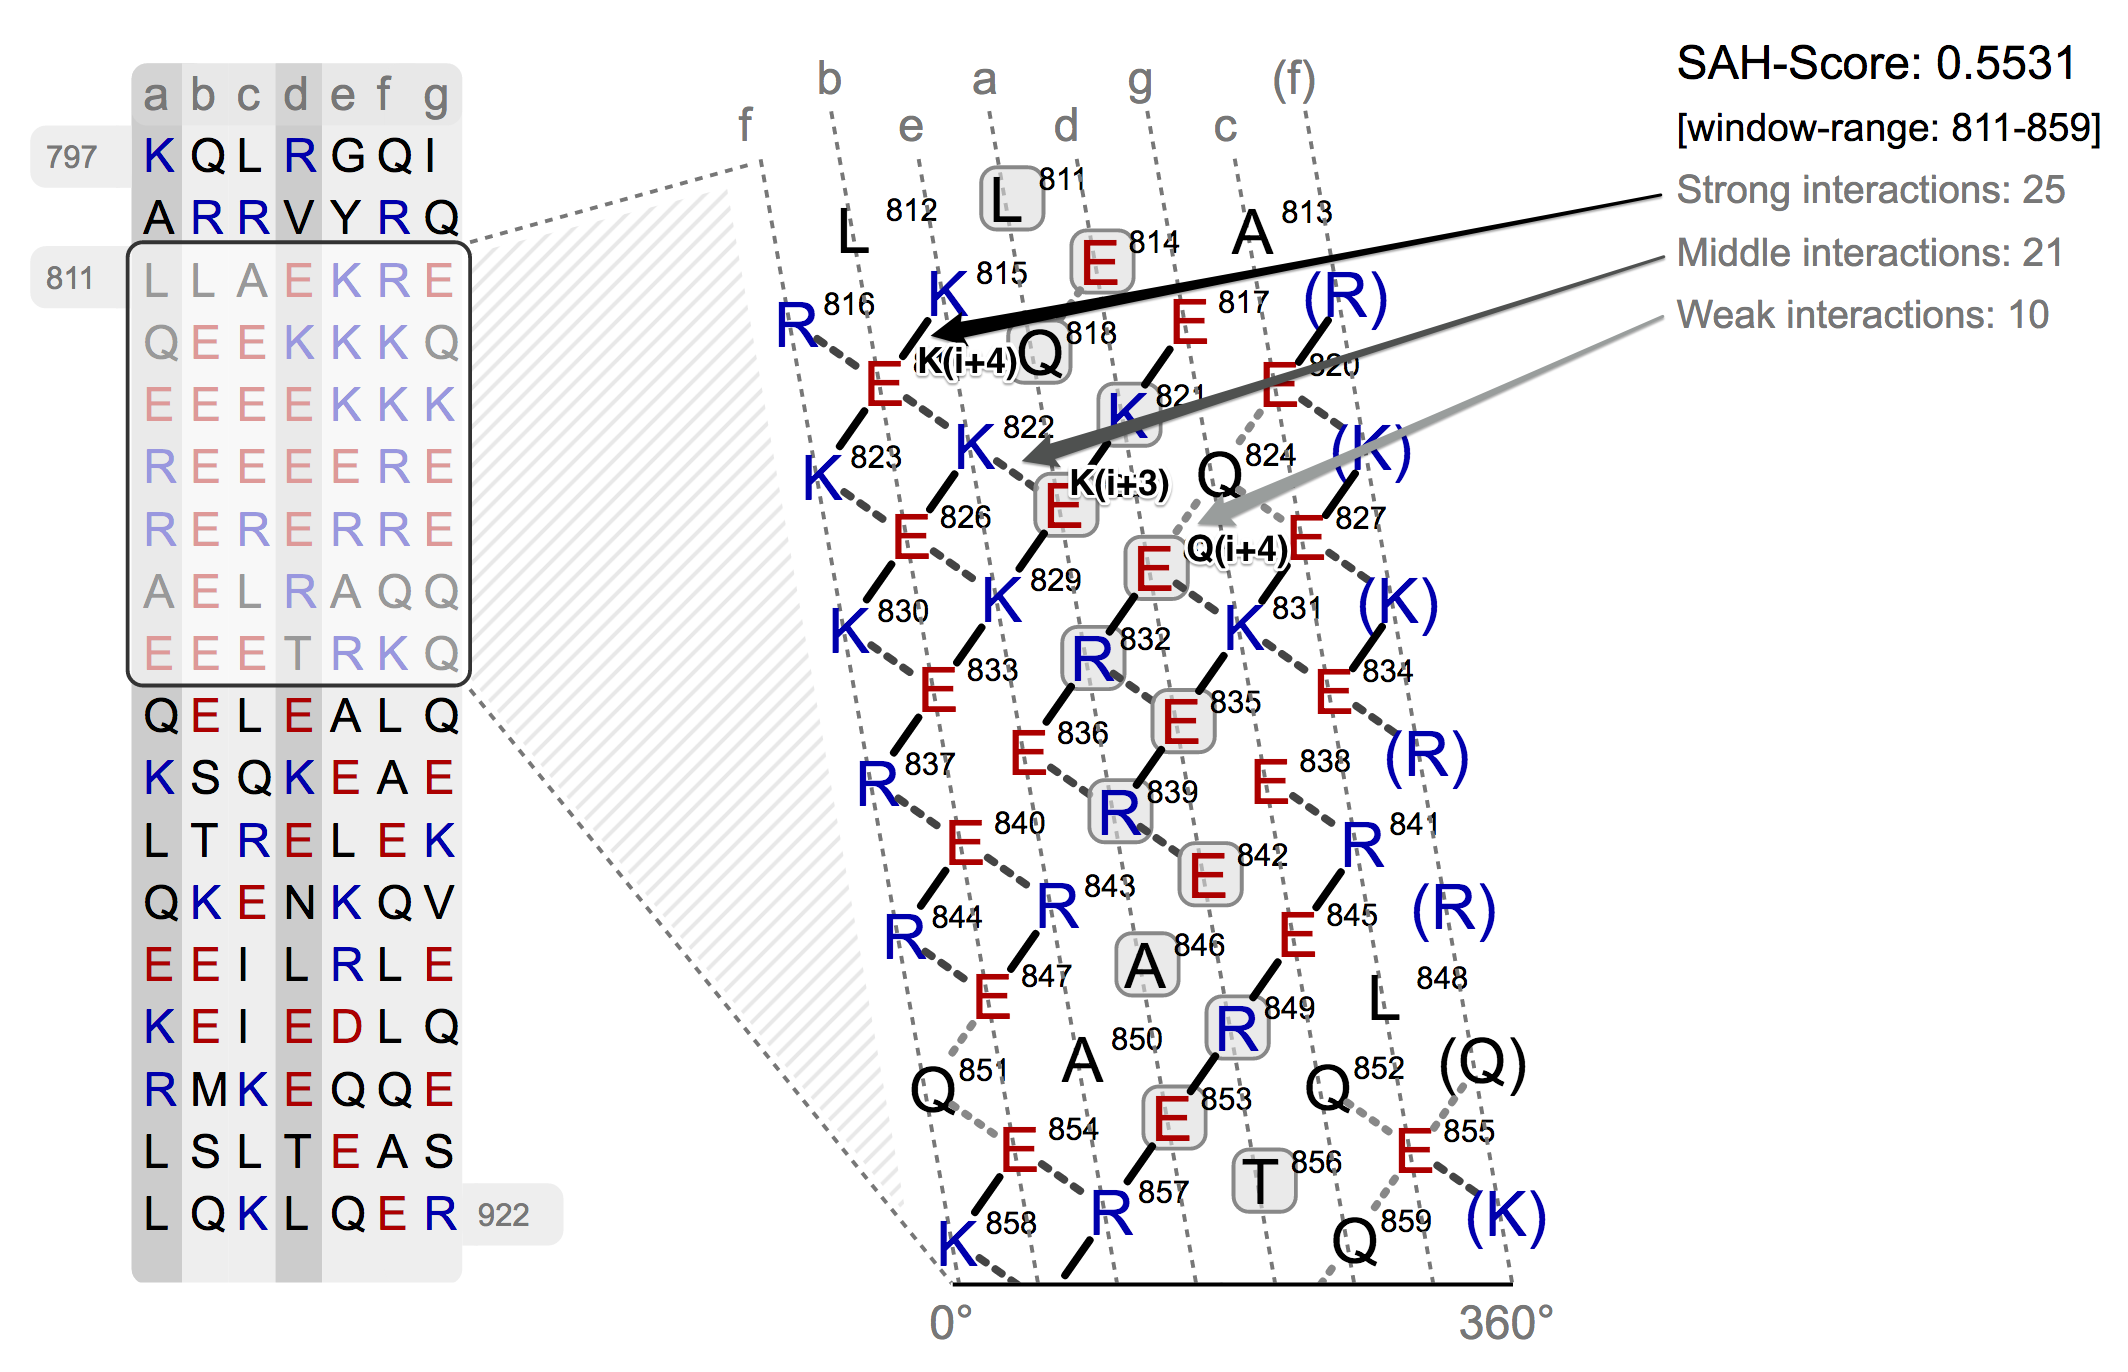
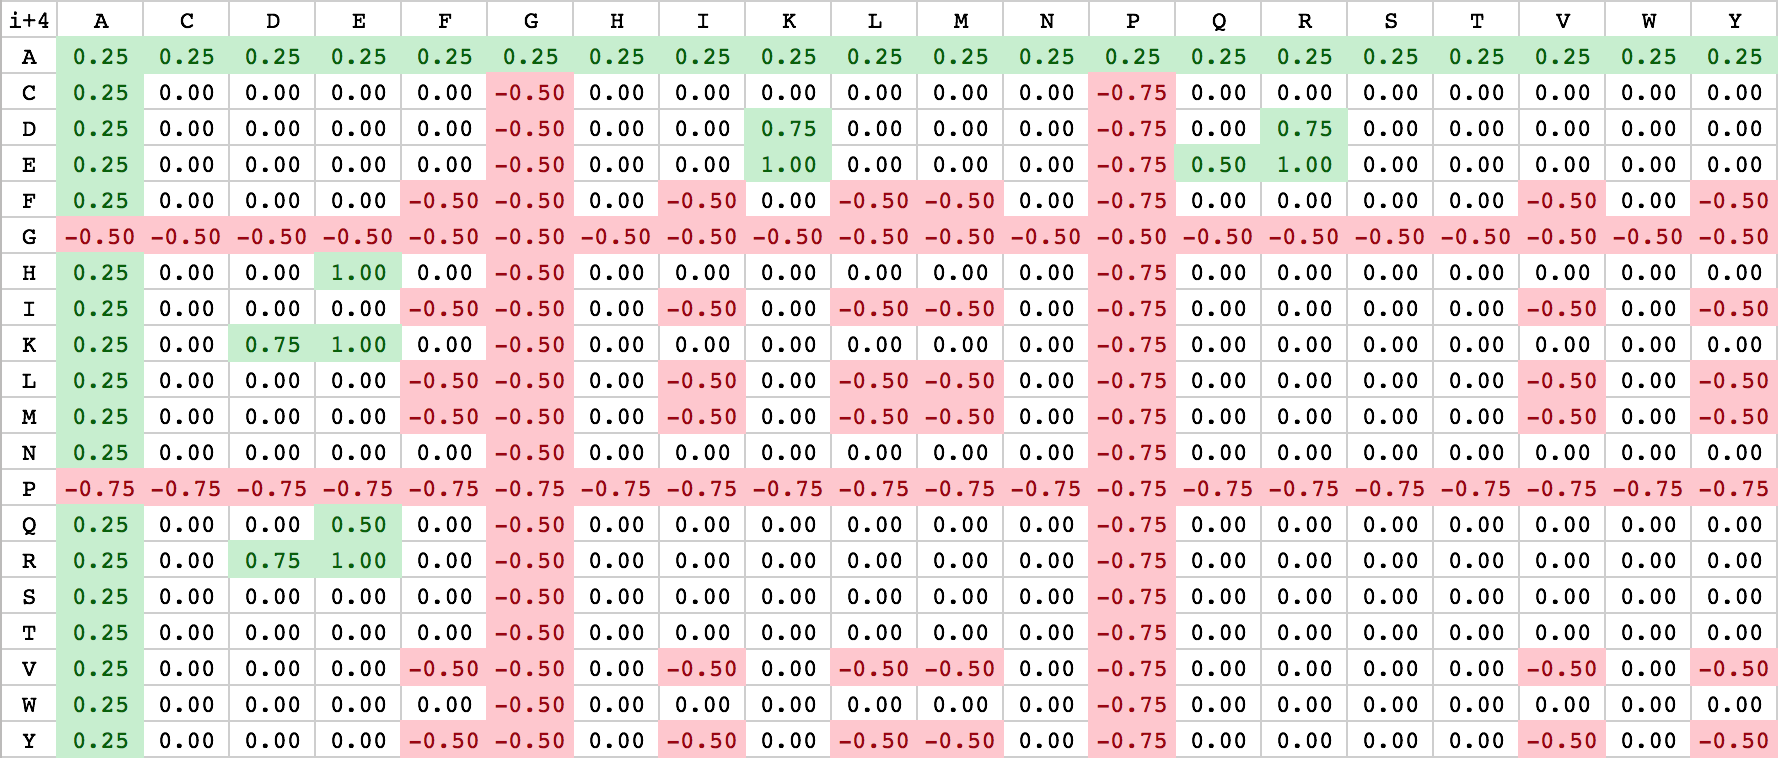
The helical net has to be read in rows always starting from right to left. Between interacting residues, solid and dashed connections are drawn, which represent the strong and weak type of interactions. As you can see from the figure above, the black drawn lines are strong interactions and the dashed grey ones are weak. The classification of the interaction lines results from the rules, aside the helical net. For instance the black rule E(i-4) has the meaning, that between a residue E and the upper-right residue (i-4 positions) will probable a strong interaction develop. The other rules can be applied accordingly. The used weights for the scoring algorithm can be seen from the table below.
In the top-right corner of the helical net view the SAH-score with the number of the strong and weak interactions is displayed. On the left side of the helical net diagram an overview is depicted, which shall give an idea of the position of selected region in the sequence and its surrounding residues.
| Source Residue | Target residue | Interaction | Score | |
|---|---|---|---|---|
| E | ⟹ | K/R | i+4 | 1.0 |
| H/K/R | ⟹ | E | i+4 | 1.0 |
| D | ⟹ | K/R | i+4 | 0.75 |
| E | ⟹ | K/R | i+3 | 0.75 |
| H/K/R | ⟹ | E | i+3 | 0.75 |
| Q | ⟹ | E | i+4; i+3 | 0.5 |
| E | ⟹ | Q | i+4; i+3 | 0.5 |
| E | ⟹ | H | i+3 | 0.5 |
| K/R | ⟹ | D | i+3 | 0.5 |
| D | ⟹ | K/R | i+3 | 0.5 |
| F/I/L/M/V/Y | ⟹ | F/I/L/M/V/Y | i+4; i+3 | -0.5 |
| A | ⟹ | [A-Y] | i+4; i+3 | 0.25 |
| G | ⟹ | [A-Y] | i+4; i+3 | -0.5 |
| P | ⟹ | [A-Y] | i+4; i+3 | -0.75 |

SAH-Scoring
Helices, that are not buried within globular structures or coiled-coil helix dimers with hydrophobic seams at their interfaces, need networks of charge interactions for stabilization in water. For example, poly-alanine peptides adopt α-helical conformations in water only when they contain oppositely charged residues in distances appropriate to form salt bridges. In the late 1980th and early 1990th many studies have been performed using such poly-alanine models aiming to resolve the conditions for helix formation and stabilization. Different amino acids (mainly Asp, Glu, Lys and Arg, but in some cases also Gln) were introduced in various combinations at varying distances, the corresponding peptides synthesised, their α-helicity experimentally determined by, for example, circular dichroism, and stabilization energies obtained by fitting models to the data.
According to these experiments, helices are stabilized by charged interactions (salt bridges) between residues at i, i+3 and i, i+4 [1, 2] and hydrogen-bonding interactions between polar/charged residues at i, i+3 and i, i+4 [3, 4]. Additional stability can be obtained through networks of oppositely charged residues in i, i+3, i, i+6, or i, i+3, i, i+7, or i, i+4, i, i+7, or i, i+4, i, i+8 distances [5]. In addition to these poly-alanine based peptides, studies have been performed on peptides with complex amino acid distributions [6, 7]. However, each study used different combinations of residues and the experimental conditions (e.g. salt concentrations) were out of the physiological range. Therefore, it is not possible to tabulate all possible combinations and provide comparable stabilization energies. Here, we compared many of the published stabilization energies, tried to set them into relation and define stabilization values for all types of salt bridges and hydrogen-bonding interactions. These stabilization values are summarized for a given sequence window to determine a SAH score. In addition to binary interactions, additional stabilization is added for networks of at least three residues (see above), and destabilizing effects through networks of hydrophobic residues in i, i+3, i, i+6, or i, i+3, i, i+7, or i, i+4, i, i+7, or i, i+4, i, i+8 distances, which would favour coiled-coil formation, are taken into account.
Prediction results: GnuPlot and Tabular
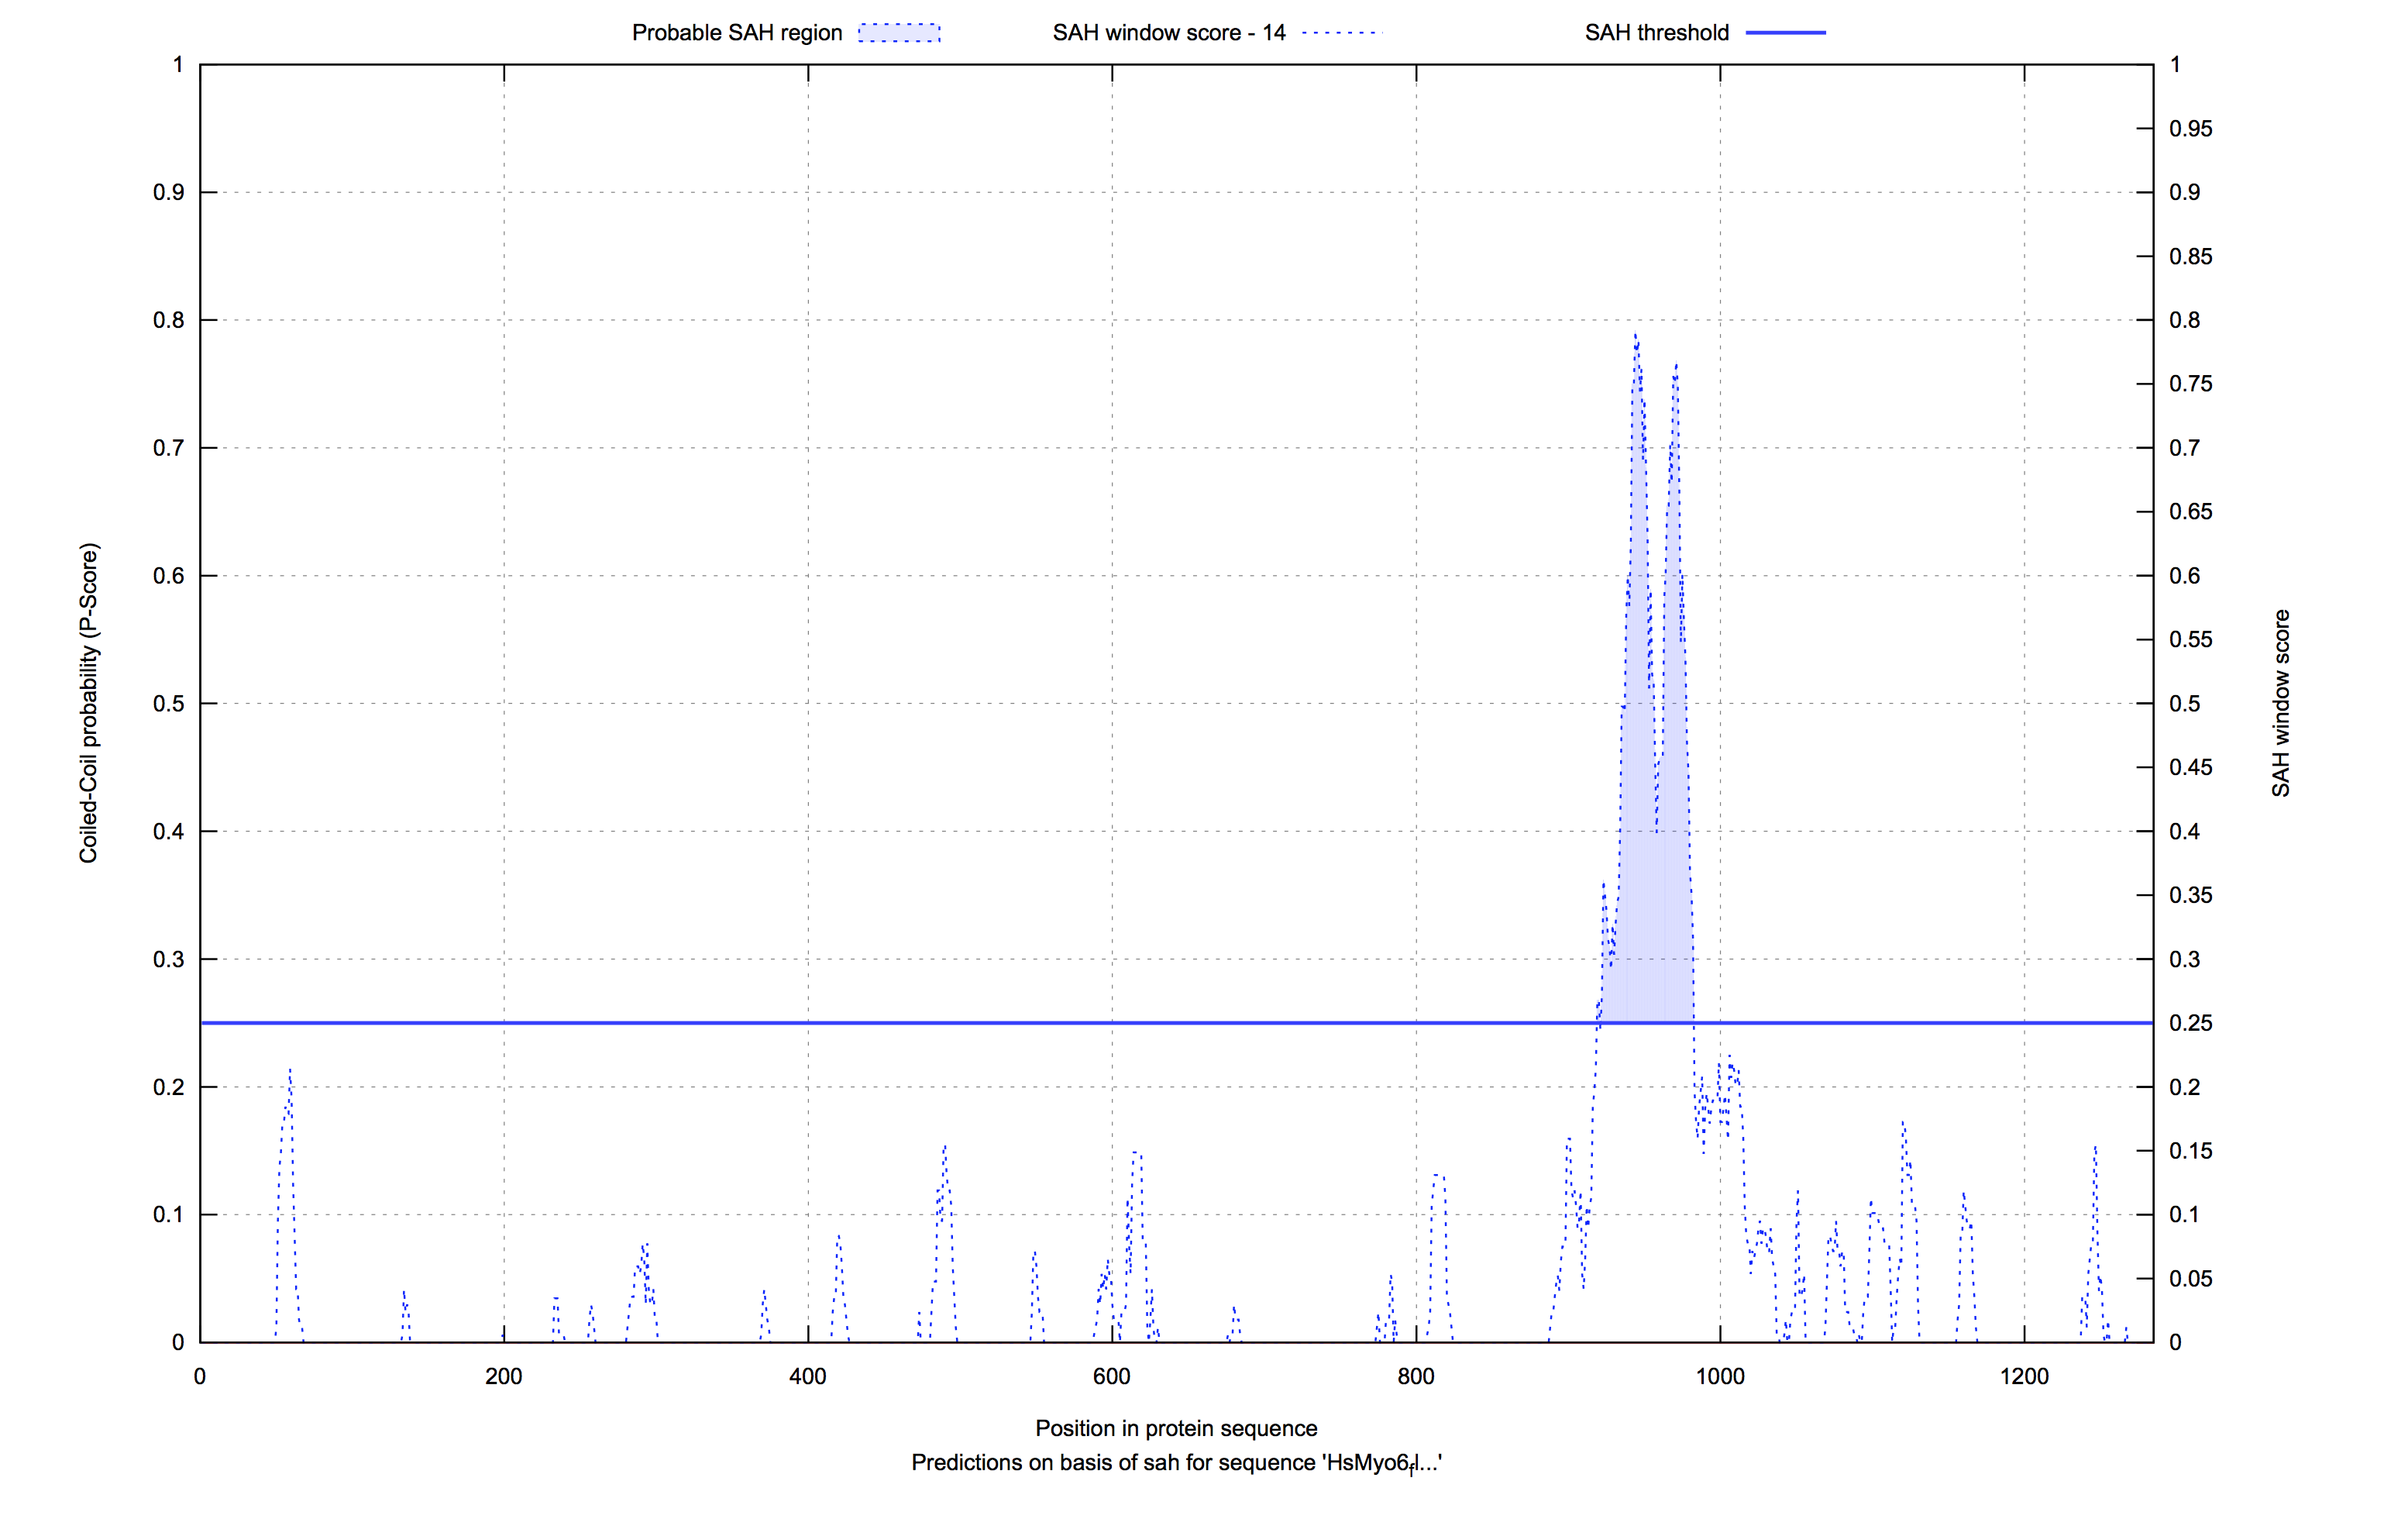
In the last result subsection the computed analyses are presented as plotted graphs (GnuPlot) and as pure values in the table aside. For each analysis there is a tab, which holds the relevant prediction data. The plot combines both predictions (coiled-coil & according SAH) in one graph and visualizes the probabilities over the length of the sequence. Filled areas in blue/red give a hint, as described in the legend of the figure below, whether there is a probable coiled-coil or SAH region or not. This depends on the in dashed lines drawn thresholds. Our values for the thresholds were chosen by analysing an annotated PDB-dataset, where the exact regions of coiled-coils and single-alpha-helices were available.
Left to it are the prediction values listed in a table. Each line follows the structure: Sequence position, residue, heptad pattern position, coiled-coil prediction probability and SAH prediction probabilility.
Rights and Restrictions
Using Waggawagga by non-academics requires permission. Waggawagga may be obtained upon request and used under a GNU General Public License.
References
This last section is a listing of all publications with methodical influence on the implementation of the scoring algorithm and the visualizations and of the software, which has been used to realize this service. The focus here lies mainly on the bioinformatic coiled-coil prediction tools.
Methodical References
The following list shows the literature that helped to develop the theoretical base of the SAH prediction:
| [Marqusee1987] | Marqusee S, Baldwin RL. 1987. Helix stabilization by Glu-...Lys+ salt bridges in short peptides of de novo design. Proc Natl Acad Sci U S A, 84:8898–8902. |
| [Baldwin1993] | Huyghues-Despointes BM, Scholtz JM, Baldwin RL. 1993. Helical peptides with three pairs of Asp-Arg and Glu-Arg residues in different orientations and spacings. Protein Sci Publ Protein Soc, 2:80–85. |
| [Scholtz1993] | Scholtz JM, Qian H, Robbins VH, Baldwin RL. 1993. The energetics of ion-pair and hydrogen-bonding interactions in a helical peptide. Biochemistry (Mosc), 32:9668–9676. |
| [Smith1998] | Smith JS, Scholtz JM. 1998. Energetics of polar side-chain interactions in helical peptides: salt effects on ion pairs and hydrogen bonds. Biochemistry (Mosc), 37:33–40. |
| [Olson2001] | Olson CA, Spek EJ, Shi Z, Vologodskii A, Kallenbach NR. 2001. Cooperative helix stabilization by complex Arg-Glu salt bridges. Proteins, 44:123–132. |
| [Lyu1989] | Lyu PC, Marky LA, Kallenbach NR. 1989. The role of ion pairs in .alpha. helix stability: two new designed helical peptides. J Am Chem Soc, 111:2733–2734. |
| [Lyu1990] | Lyu PC, Liff MI, Marky LA, Kallenbach NR. 1990. Side chain contributions to the stability of alpha-helical structure in peptides. Science, 250:669–673. |
| [Peckham2009] | Michelle Peckham and Peter J. Knight. 2009. When a predicted coiled coil is really a single alpha-helix, in myosins and other proteins. The Royal Society of Chemistry - Soft Matter, 5:2493–2503. doi:10.1039/b822339d. |
Software References
The following list shows all main software packages that are part of the web-application:
| [BioRuby] | Naohisa Goto, Pjotr Prins, Mitsuteru Nakao, Raoul Bonnal, Jan Aerts and Toshiaki Katayama. 2010. BioRuby. Bioinformatics, 26: 2617–2619. |
| [Ncoils] | Andrei Lupas, Marc Van Dyke and Jeff Stock. 1991. Predicting coiled coils from protein sequences. Science, 252(5009): 1162-1164. |
| [Marcoil] | Mauro Delorenzi and Terry Speed. 2002. An HMM model for coiled-coil domains and a comparison with PSSM-based predictions. Bioinformatics, 18: 617–625. |
| [Multicoil] | Peter S Kim, Bonnie Berger and Ethan Wolf. 1997. MultiCoil: A program for predicting two-and three-stranded coiled coils. Protein Science, 6: 1179–1189. |
| [Multicoil2] | Jason Trigg, Karl Gutwin, Amy E Keating and Bonnie Berger. 2011. Multicoil2: Predicting Coiled Coils and Their Oligomerization States from Sequence in the Twilight Zone. PLOS ONE, 6: 1–10. |
| [Paircoil] | Bonnie Berger, David B. Wilson, Ethan Wolf, Theodore Tonchev, Mari Milla, and Peter S. Kim. 1995. Predicting Coiled Coils by Use of Pairwise Residue Correlations. Proceedings of the National Academy of Science USA, 92: 8259-8263. |
| [Paircoil2] | Andrew V McDonnell, Taijiao Jiang, Amy E Keating and Bonnie Berger. 2006. Paircoil2: improved prediction of coiled coils from sequence. Bioinformatics, 22: 356–358. |
| [PrOCoil] | C C Mahrenholz, I G Abfalter, U Bodenhofer and R Volkmer. 2010. PrOCoil - Advances in predicting two-and three-stranded coiled coils. homo. |
| [LOGICOIL] | Thomas L Vincent, Peter J Green and Derek N Woolfson. 2013. LOGICOIL — Multi-state prediction of coiled-coil oligomeric state. Bioinformatics, 29: 69–76. |